Building a crypto pairs trading strategy in Python
Let’s go straight to the point without any fluff.
Below is an implementation of pairs trading strategy based on Binance data. First, we import several libraries.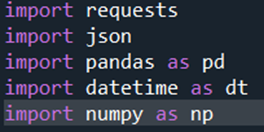 Then, we create a list containing multiple coins trading at Binance.
You can, of course, add or remove as many items from this array as you wish.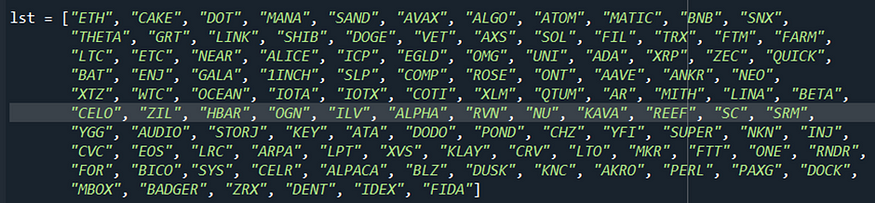 In the next lines we define variables pair, root_url interval which allow us to fetch historical data from Binance. Then we read data with the following line:
data = json.loads(requests.get(url).text)
When you look at the content of data variable, you’ll see something like this: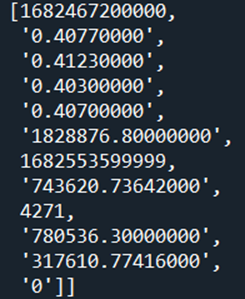 Doesn’t look nice, does it? Let’s convert it to data frame with the following:
df = pd.DataFrame(data)
Now our df looks like this: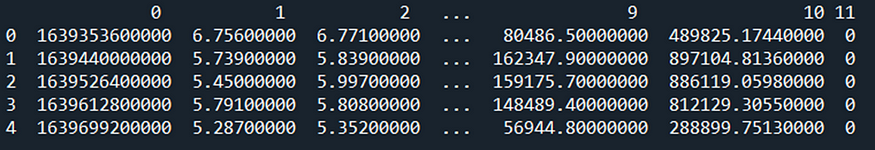 Much better now, but we don’t know those column names mean. This is where Binance API docs can be useful.
We’ll rename our columns with the following code:
df.columns = ['open_time',
              'o', 'h', 'l', 'c', 'v',
              'close_time', 'qav', 'num_trades',
              'taker_base_vol', 'taker_quote_vol', 'ignore']
Our data frame is now in human-understandable form.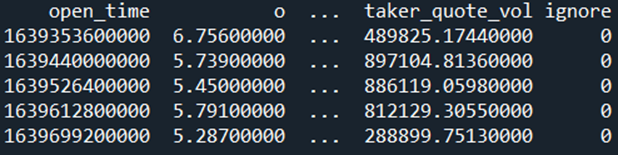 However, open_time is in Unit time, a date and time representation widely used in computing. Though most programming languages return date and time in Unit time, it may not be clear for novices what it means. We can solve this with the line below:
df.index = [dt.datetime.fromtimestamp(x/1000.0) for x in df.close_time]
This is our create_df() function which we mostly explained below
def create_df():
    pair = "USDT"
    root_url = 'https://api.binance.com/api/v3/klines'
    interval = '1d'
    close_prices = pd.DataFrame()
    for i in lst:
        url = root_url + '?symbol=' + i + pair + '&interval=' + interval
        data = json.loads(requests.get(url).text)
        if 'msg' in data:
            pass
        else:
            df = pd.DataFrame(data)
            df.columns = ['open_time',
                          'o', 'h', 'l', 'c', 'v',
                          'close_time', 'qav', 'num_trades',
                          'taker_base_vol', 'taker_quote_vol', 'ignore']
            df.index = [dt.datetime.fromtimestamp(x/1000.0) for x in df.close_time]
            close_price = df['c']
            close_prices[i] = close_price
    close_prices = close_prices.apply(pd.to_numeric)
    return close_prices
Calling this function will return a data frame containing historical price data from Binance on the tokens we specified.
So, our data frame contains the historical data from Binance in a human-readable format. The next step is to calculate daily returns of coins so we can compute correlations of the returns. pct_change() function of Pandas is perhaps the most Pythonic way of doing this.
def calculate_daily_return(df):
    daily_return = df.pct_change(1)
    return daily_return
The next function takes a data frame of daily returns and creates a correlation matrix of the returns. Let’s go through the lines. First, we create a correlation matrix with the corr() function. Then we convert our dataframe to a big column with melt() function.
We have to drop all correlations with the value of 1 since these are correlations of coins with themselves; we are not interested in these ones. What we’re interested in is correlations of coins with other coins. We also ignore correlations with the value below 0.75 because they don’t indicate a strong relationship between two assets. I don’t claim that 0.75 is much better than ony other threshold but we must begin somewhere. Finally, the column is sorted in a descending manner which is stored in sorted_corrs variable. The function returns sorted_corrs.
def correlations(df):
  corr_matrix = df.corr()
  correlations_df = corr_matrix.melt()
  correlations_df = correlations_df.loc[(correlations_df["value"] != 1.0) & (correlations_df["value"] >= 0.75)]
  sorted_corrs = correlations_df.sort_values(ascending=False, by="value")
  return sorted_corrs
Now that we have a list of correlated assets, we can select 10 most correlated asset pairs. You can select any number of pairs but for this model we’ll stick to 10. With the for loop, we go through the list of correlations and put highly correlated coin pairs into coins list. One clarification should be made here. The thing is that a particular coin, say, coin A, can be correlated both with coin B and coin C. This is not what we want in this model because this will double our risk. An example will make this clearer.
Let’s say, due to hype the price of the token MANA rose significantly. We find out that during the most recent 30 days (our lookback period) MANA is correlated both with ENJ and SAND. The spike caused MANA to trade over the historical ENJ-MANA and SAND-MANA spreads. This means that we have to take a short position in both pairs, i.e., in the first trade we buy ENJ and sell MANA, and in the second trade we buy SAND and sell MANA. We’ll risk more money with MANA than with other coins. If we have $10,000 and we allocate $1,000 to each trade, this implies we’ll trade each leg of each pair with $500. But since MANA is in two trades, we’ll risk $1,000 with this particular coin. I’ll repeat again here — this is not what we want to do. So, this should be avoided. If you go through the code, you’ll see that’s what the script does.
The pairs of the coins are stored as tuples in coins, which is returned by the function.
# select 10 most highly correlated pairs
def unique_pairs(df):
  # create an empty list where we'll store pairs of correlated tokens
  coins = []
  # temporary array
  out = []
  high_corrs_array = list(df["variable"])
  for i in range(0, len(df), 2):
    if high_corrs_array[i] not in out and high_corrs_array[i+1] not in out:
      tupl = (df.iloc[i]["variable"], df.iloc[i+1]["variable"])
      coins.append(tupl)
      out = [item for t in coins for item in t]
      if len(coins) == 10:
        break
    return coins
This is the first part of the series. Here we fetched data from Binance and learned how to calculate daily returns and correlations between them. We also wrote code to selected the most correlated X (which is 10 in our case) cryptocurrency pairs. In the following article, I’ll build on top of this and will describe how to build a real pairs trading strategy.


![RichBeak News [EN]:How options expiration will affect BTC and ETHA large number of bitcoin (BTC)](https://cdn.bulbapp.io/frontend/images/e128f363-f0c0-413d-a2da-4e9ba9c1e258/1)


