The Best Trend Indicators For Trading In 2023 ( part 2 , Bollinger Band , MACD )

#1 – The Bollinger Band (BB) Indicator
 The first technical indicator in this list might be the most utilised indicator on the global market. The BB indicator uses the mathematical concept of standard deviation to identify the unusual outliers in pricing movements. The standard deviation formula was invented to identify outlier data points in a data set. Naturally, identifying outlier pricing trends is crucial in the trading markets, and the BB indicator allows investors to visualise these breakpoints simply.
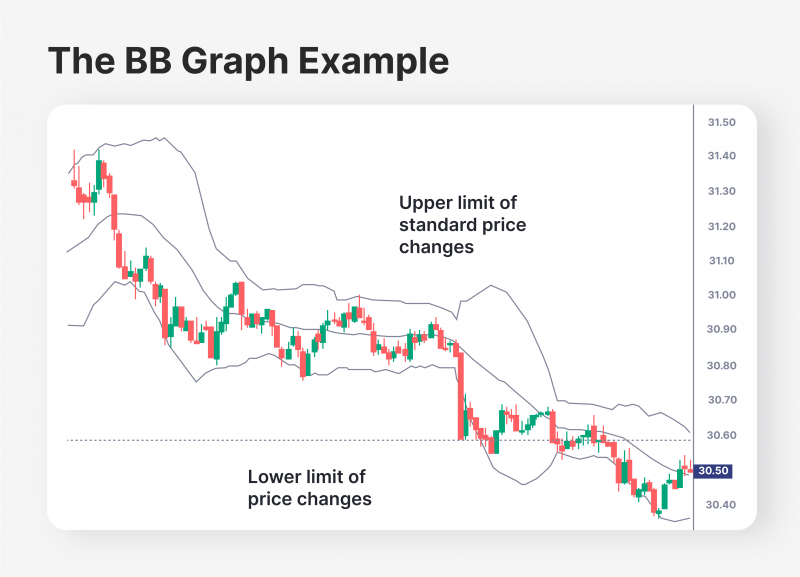
The BB indicator employs three bands to visualise the price movement graph. The upper and lower bands represent standard deviations. If the asset price crosses either of these bands, it is considered an outlier event.
But why are the breakpoints important, exactly? They indicate that an asset price has hit an unexpected figure, which is highly likely to be corrected by the market. For example, imagine that asset A has steadily increased for the past three months. However, during a short 2-day period, asset A suddenly appreciated by 40%. This price movement is well outside the BB indicator’s top band. Therefore, it is probable that asset A is overbought and is bound to enter a price decrease trend shortly. While asset A might continue this unlikely trend, the BB indicator states that it is not likely. Investors can continue to hold the asset, but it is probable that asset A is about to lose its value and return within the standard deviation interval.
The same is true for the inverse of this use case. If asset A’s price drops below the standard deviation, chances are that the asset is currently undervalued, and it might be a great time to invest. Thus, the BB indicator can identify overbought and oversold conditions for specific investments, which makes it one of the most essential indicators available on the market.
#2 – The Moving Average Convergence Divergence (MACD) Indicator
 The MACD indicator is yet another globally utilised trend and momentum indicator, simplifying the price movement analysis. The MACD formula is a subset of moving average indicators that measure asset opening and closing price movements in different timeframes and with varying levels of complexity. There are three major variations for moving averages – Simple Moving Average (SMA), Exponential Moving Average (EMA), and Weighted Moving Average (WMA). Each of them is used to conduct different types of moving average analysis. The MACD indicator utilises the EMA for its calculations.
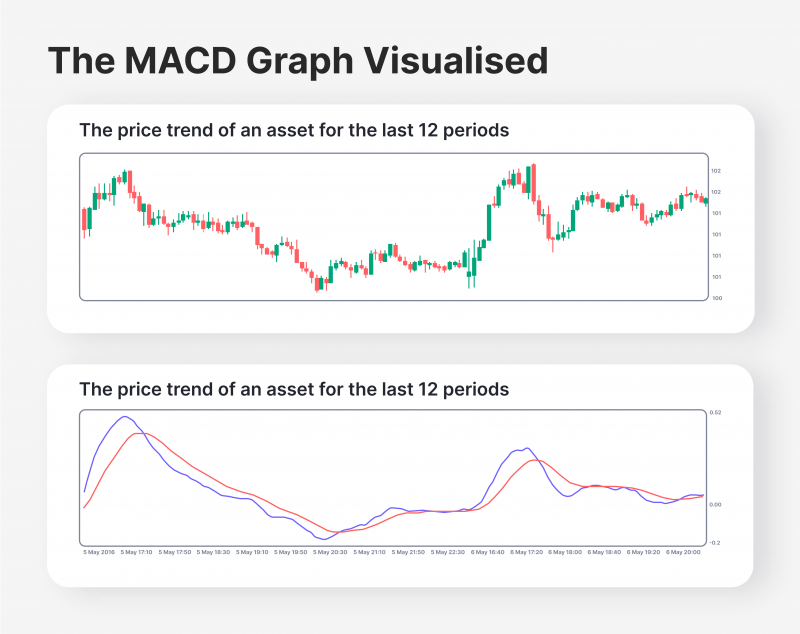
But what does the MACD measure? It identifies the relationship between two EMAs related to a particular tradable asset. The EMA itself is an exponential moving average for tradable assets. The EMA formula is similar to the simple moving average but emphasises the recent price changes in its calculations. The MACD formula requires two distinct EMAs to be calculated – the 26-period EMA and the 12-period one. After that, the MACD model subtracts the 26-period line trend from the 12-period EMA. As a result, traders can measure the recent performance of a particular asset compared to its long-term empirical performance in the past. Wherever the MACD indicator becomes pessimistic alongside the graph, it signals the downward trend for a specific asset. Conversely, the positive MACD implies that the asset prices will likely increase.
As outlined above, the MACD indicator is highly functional and practical but best utilised with other indicators. While the MACD graph showcases dependable information that the asset is entering a positive or negative trend, numerous factors could keep the asset from continuing the forecasted trend. Thus, it is advisable to combine the MACD with the BB indicator to maximise the chances of forecasting the right trend.