The Impact of Experimental Bias on Study Results
About a year ago before starting this study, we ran a one-off research project into Tim Ferriss’ Slow-Carb Diet™ that turned up surprisingly strong results. Over a four week period, people who stuck to the diet showed an 84% success rate and an average weight loss 0f 8.6lbs.
But are those results legit? If I picked a person at random out of a crowd, could they expect to see the same results? Almost immediately after publishing the results we started getting feedback about experimental bias.
This first study was biased in hard-to-know ways by the demographics of Tim’s audience (maybe they’re all really heavy). That’s a fixable problem, so we set off to redo the study in a bigger and more rigorous way.
That led to the Quantified Diet, our quest to verify and compare every popular diet. We now have initial results for ten diets. This is the story of our experiment and how we’re interpreting the diet data we’ve collected.
Understanding Bias
To understand bias, here’s quick alternative explanation for our initial Slow-Carb data: a group of highly motivated, very overweight people joined the diet and lost what, for them, is a very small amount of weight. In this alternative explanation, the results really are not very interesting and they definitely aren’t generalizable.
However, we had some advice from academics at Berkeley aimed specifically at overcoming the biases of the people who were self-selecting into our study. The keys: a control group following non-diet advice and randomized assignment into a comparative group of diets.
Our Experimental Design
The gist of our experimental design hinged on the following elements:
- We were going to start by comparing ten approaches to diet: Slow-Carb, Paleo, Whole Foods, Vegetarian, Gluten-free, No sweets, DASH, Calorie Counting, Sleep More, Mindful Eating.
- Coach.me wrote instructions for each diet, with the help of diet experts, and provided 28-day goals (with community support) for each diet inside our app.
- We included two control groups, one with the task of reading more and the other with the task of flossing more.
- Participants were going to choose which of the approaches they were willing to try and then we would randomly assign from within that group. Leaving some room for choice allowed people to maintain control over their health, while still giving us room to apply a statistically relevant analysis.
- Participants who said they were willing to try a control group and at least two others were in the experiment. This is who we were studying.
- A lot of people didn’t meet this criteria, or opted out at some point along the way. We have observational data on this group, but they can’t be considered scientifically valid results for the reasons around bias covered above.
- Full writeup of the methodology coming.
Top Level Results
At the beginning of the study, everyone thought we were going to choose a winning diet. Which of the ten diets was the best?
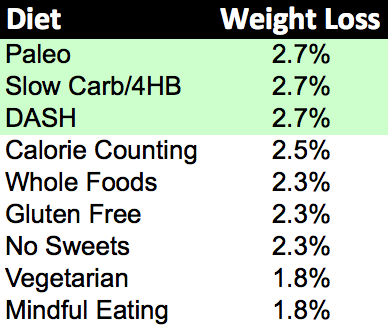
Nine of the diets performed well as measured by weight loss. Here’s the ranking, with weight loss measured as a percentage of body weight. Slow-Carb, Paleo and DASH look like they led the pack (but keep reading because this chart absolutely does not tell the whole story). If you don’t like doing math, the above chart translates to between 3-5lbs per month for most people. If you really don’t like doing math, we built a calculator for you that will estimate a weight loss specific to you.
Sleep, which never really had a strong weight loss hypotheses, lost. We ended up calling this a placebo control in order to bolster our statistical relevance.
Before moving on, lets just call out that people in the diets were losing 4-ish pounds over a one month period on average. That’s great given that our data set contains people who didn’t even follow their diet completely.
The Value of the Control
The control groups help us understand whether the experimental advice (to diet) is better than doing nothing. Maybe everyone loses weight no matter what they do?
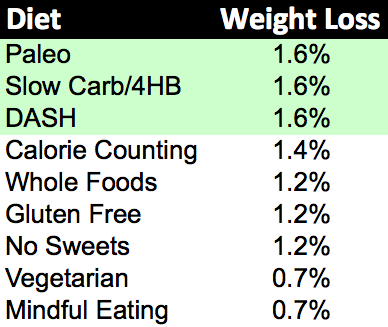
This sounds unlikely, but we were all surprised to see that the control groups lost 1.1% of their body weight (just by sleeping, reading and flossing!)
Is that because they were monitoring their weight? Is it because the bulk of the study occurred in January, right after people finished holiday gorging? We don’t actually know why the control groups lost weight, but we do know that dieting was better than being in the control.
Here’s the weight-loss chart revised to show the difference between each diet and the control (this chart shows the experimental effect).
The Value of Randomized Assignment
Randomized assignment helps us feel confident that the weight loss is not specific to the fans of a particular diet.
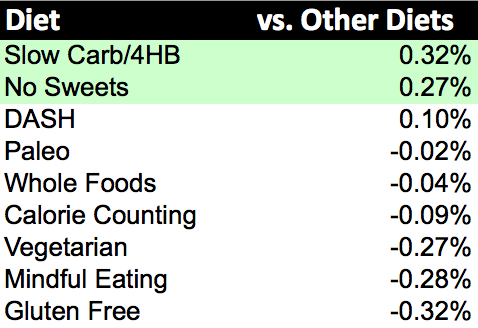
Because of the randomization, we can ask the following question. For each diet, what happens if we assigned the person to a different diet?
This is an indicator of whether a diet is actually better or if the people who are attracted to a diet have some other characteristic that is effecting our observational results.
The obvious example of bias would be a skew toward male or female. Bigger people have more weight to lose (male), plus we observed that males tended to lose a higher percentage of their body weight (2.8% vs. 1.8%).
Comparing the diets this way adds another promising diet approach: no sweets. But let’s, be real, the differences between these diets are very small, less than half a pound over four weeks, as compared to doing any diet at all, five pounds over four weeks. Our advice is pick the diet that’s most appealing (rather than trying to optimize).
Soda is bad! And other Correlations.
What else leads to weight loss?
- It helps if your existing diet is terrible (your new diet is even better in comparison). People who reported heavy pre-diet soda consumption lost an extra 0.6% body weight.
- Giving up fast food was also good for an extra 0.6% (but probably not worth adding fast food just to give it up).
- Men lost more weight (2.6% vs 1.8%).
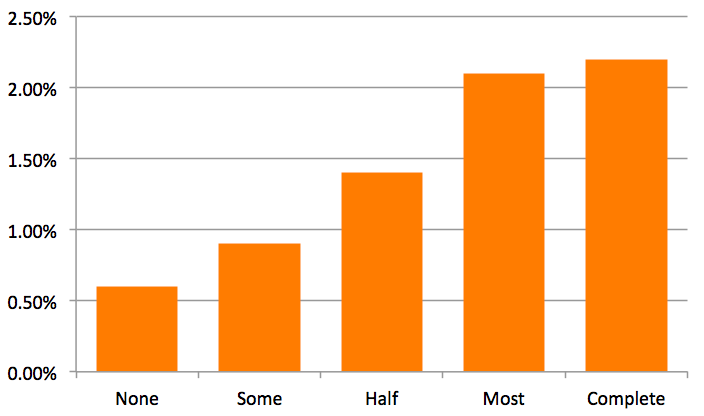
- Adherence mattered (duh). Here’s a chart with weight loss by adherence.
 How much of the time did people follow the diet advice?
Choosing a Diet
Ok. Now I think I’ve explained enough that you could choose one of these diets. All of them are available via the Coach.me app available on the web, iPhone and Android.
Given that all the diets work, the real question you should be asking yourself is which one do you most want to follow.
I can’t stress that enough. It’s not just about which had the most weight loss. Choose a diet you can stick to.
Let’s Talk Success Rate
Adherence matters. Even half-way adherence to a diet led to more than 1% weight loss (better than the control groups).
This brings up an interesting point. So far, our data is based on the people who made it all the way to the end of our study. This is the survivor bias. We don’t know what happened to the other people (hopefully the diets weren’t fatal).
In order to judge the success rate of dieting you’ll have to use some judgement. But we can give you the most optimistic and most pessimistic estimates. The truth is somewhere in between.
Of people who gave us all of their data over four weeks, 75% lost weight. Let’s call this the success rate ceiling. It includes many reasons for not losing weight, including low adherence. But at least they paid attention to the goal for the entire time. The weight loss averages are based on this group.
Of people who joined the study, only 16% completed the entire study (and 75% of those lost weight). So, merely joining a diet, with no other data about your commitment, has a success rate of 12%. Let’s call this the success rate floor.
Read that floor as 12% of people who merely said that they were interested in doing a diet had definitely lost weight four weeks later. There’s no measure of commitment in that result. If we filter by even a simple commitment measure, such as the person fills out the first survey on day one, then the success rate jumps from 12% to 28%.
If you are making public policy, then maybe that 12% number looks important. People have more goals than they have willpower for. That’s just the way our ambition works. They give up, get distracted, or prioritize some other goal.
If you are an individual, I’d put more weight in the ceiling. You want to know that whatever path you choose has a chance of succeeding. 75% is a number that should give you confidence.
Losing Weight?
We’ve focused on losing weight for two reasons. One, it’s a very common goal. But, two, it’s also the strongest signal we got out of our data.
We also measured happiness and energy but the signal was weak. We didn’t measure any other markers of health. That’s important to note.
We are behavior designers, so we’re looking at the effectiveness of behavior change advice. You should still consult a nutritionist when it comes to the full scope of health impacts from a diet change. For example, you could work with our partner WellnessFX for a blood workup (and talk to their doctors).
Open Sourcing the Research
We’ve open sourced the research. You can grab the raw data and some example code to evaluate it from our GitHub repository.
All of the participants were expecting to have their data anonymized for the purposes of research. Take a look and please share your work back (attrribution, at minimum, is required by the CC and MIT licenses).
There was some lossiness in the anonymization process. We’ve stripped out personal information (of course), but also made sure that rows in the data set can’t be tied back to individual Coach.me accounts. For that reason some of the data is summarized. For example, weight is expressed as percentage weight loss and adherence is expressed on a 1-5 scale.
If you want to go digging around in the data, I would suggest starting by looking at our surveys where we got extra data about the participants: day 1, week 1, week 2, week 3, week 4.
Citizen Science or No Science
I’m expecting that our research will spark some debate about the validity of scientific research from non-traditional sources. I expect this because I’ve already been on the receiving end of this debate.
Here’s how we’re seeing it right now. I acknowledge that we already have a robust scientific process living in academia. And I acknowledge that the way we ran this research broke the norms of that process.
The closest parallel I can think of is the rise of citizen journalism (mostly through blogs) as a complement to traditional journalism. At the beginning there was a lot of criticism of the approach as dangerous and irresponsible. Now we know that the approach brought a lot of benefits, namely: breadth, analysis and speed.
That’s the same with citizen science. We studied these diets because we didn’t see anyone else doing it. And we’re continuing to do other research (for example: meditation) because we’re imagining a world where everything in the self-improvement space, from fitness to diet to self-help, is verifiably trustworthy.
Continuing Research
One of our core tenets with this research is that we can revise it. We didn’t have to write a grant proposal and it didn’t cost us anything to run the study. In fact, we’re already revising it.
To start with, we’re adding in one more diet: “Don’t Drink Sugar.”
We wrote this diet based on the study results and a belief in minimal effective inter


