Bitcoin and Ethereum Price Prediction as BTC Rallies 10% From Recent Bottom and ETH Sees $5 Billion
 In the dynamic world of cryptocurrency, Bitcoin’s price prediction seems bullish, especially as it experiences a noteworthy upswing, currently trading at $42,220, marking a nearly 1% increase on Sunday.
This positive trend in Bitcoin’s valuation coincides with a high-ranking representative’s praise of BlackRock’s Bitcoin ETF, hailing it as a “huge success” across various metrics.
Simultaneously, the US dollar is witnessing a decline in the wake of recent inflation figures, setting a critical stage for the upcoming Federal Reserve meeting next week. These developments collectively paint a complex but intriguing picture for Bitcoin’s future in the financial landscape.
BlackRock’s Bitcoin ETF Declared ‘Huge Success’ by Top Official
Since its recent inception, BlackRock’s iShares Bitcoin Trust (IBIT) has seen strong growth, and in an interview with Yahoo Finance, U.S. Head Rachel Aguirre expressed pleasure with the outcome. After receiving permission from the SEC, IBIT’s trading volume increased to an astounding $3 billion in just two weeks, drawing in $1.6 billion in capital.
Aguirre highlighted BlackRock’s dedication to giving investor’s access to Bitcoin, praising the product for its three USPs: better accessibility, the removal of hassles related to direct Bitcoin ownership, and offering high-caliber support.
Although Aguirre refuted rumors of a spot Ethereum ETF, she praised BlackRock for being ahead of the curve in gauging investor demand. BlackRock currently has 16,361 BTC in order to fund IBIT.
The favorable reaction highlights the increasing interest of institutions in cryptocurrencies, which is probably pushing up the price of Bitcoin.
US Dollar Weakens Post-Inflation Data, Ahead of Fed Meeting
Friday saw a little decline in the value of the US dollar as December inflation statistics confirmed the market’s expectations of a mid-year interest rate drop by the Federal Reserve. Though it might have gained for a fourth week in a row, the dollar index fell 0.1% to 103.41.
In line with expectations, the Personal Consumption Expenditures (PCE) price index increased by 0.2%, preventing annual inflation from rising above 3%. Analysts say there is no reason for the market to be concerned about inflation anytime soon, which lessens the chance of more tightening.
The dollar’s rise is being restrained by mounting disinflationary pressures globally, even though U.S. rate futures priced in a 47% chance of a rate decrease in March.
The situation with Bitcoin (BTC) is becoming better, and if investors continue to be concerned about inflation, they may become more interested in inflation-resistant assets like cryptocurrencies.
Bitcoin Price Prediction
On January 28, Bitcoin (BTC/USD) exhibits a steady uptrend, currently trading at $42,401, marking a 0.66% increase. The four-hour chart highlights pivotal price levels that are key to Bitcoin’s immediate trajectory.
The pivot point is placed at $42,161, with the asset facing immediate resistance at $43,394, followed by higher resistance levels at $44,372 and $45,581. Conversely, support levels are established at $40,957, $39,644, and $38,618.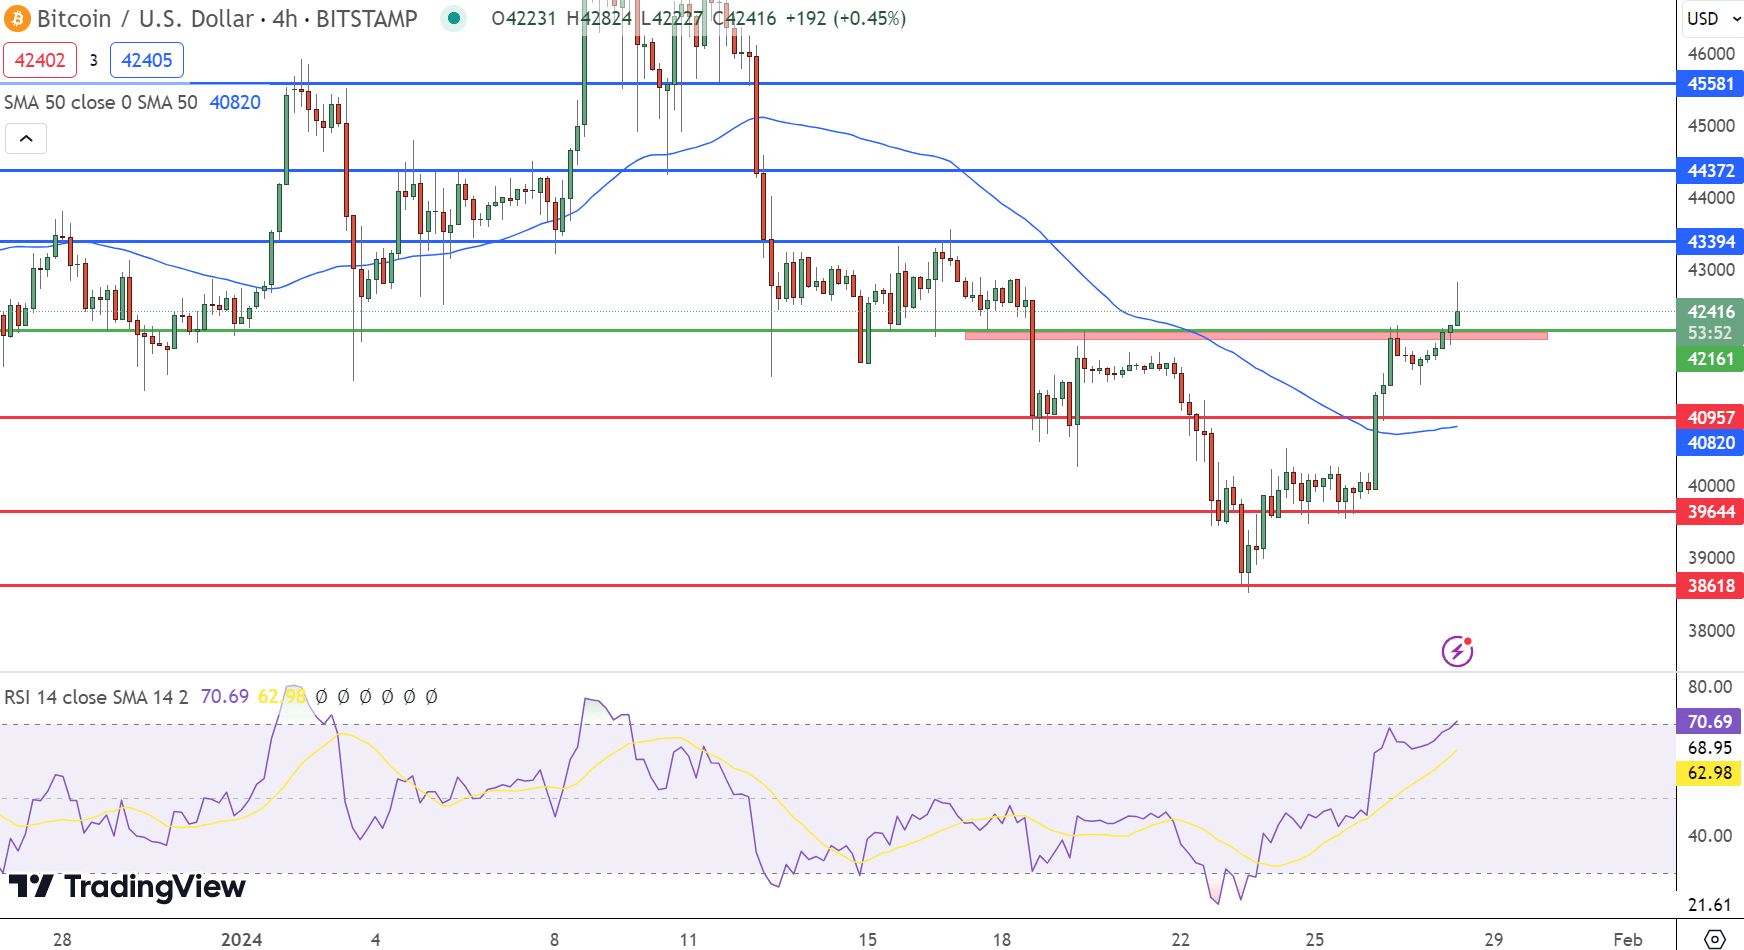 Bitcoin Price Chart – Source: Tradingview
The Relative Strength Index (RSI) is at 70, indicating a strong buying interest that borders on overbought conditions. The 50-day Exponential Moving Average (EMA) stands at $40,820, offering a significant support level.
A notable chart pattern is Bitcoin’s breakthrough above a double top around the $42,160 level. Closing above this could signal a robust buying trend, with potential for further upward movement. The overall trend for Bitcoin is bullish above the $42,160 mark.
Ethereum Price Prediction
On January 28, Ethereum exhibits a promising uptrend, trading at $2,289.7, a gain of 0.97%. The four-hour chart analysis highlights critical levels influencing Ethereum’s short-term market dynamics. Its pivot point rests at $2,321, with immediate resistance observed at $2,388.
Subsequent resistance levels are marked at $2,476 and $2,560. On the downside, Ethereum finds immediate support at $2,241, with further levels at $2,169 and $2,102.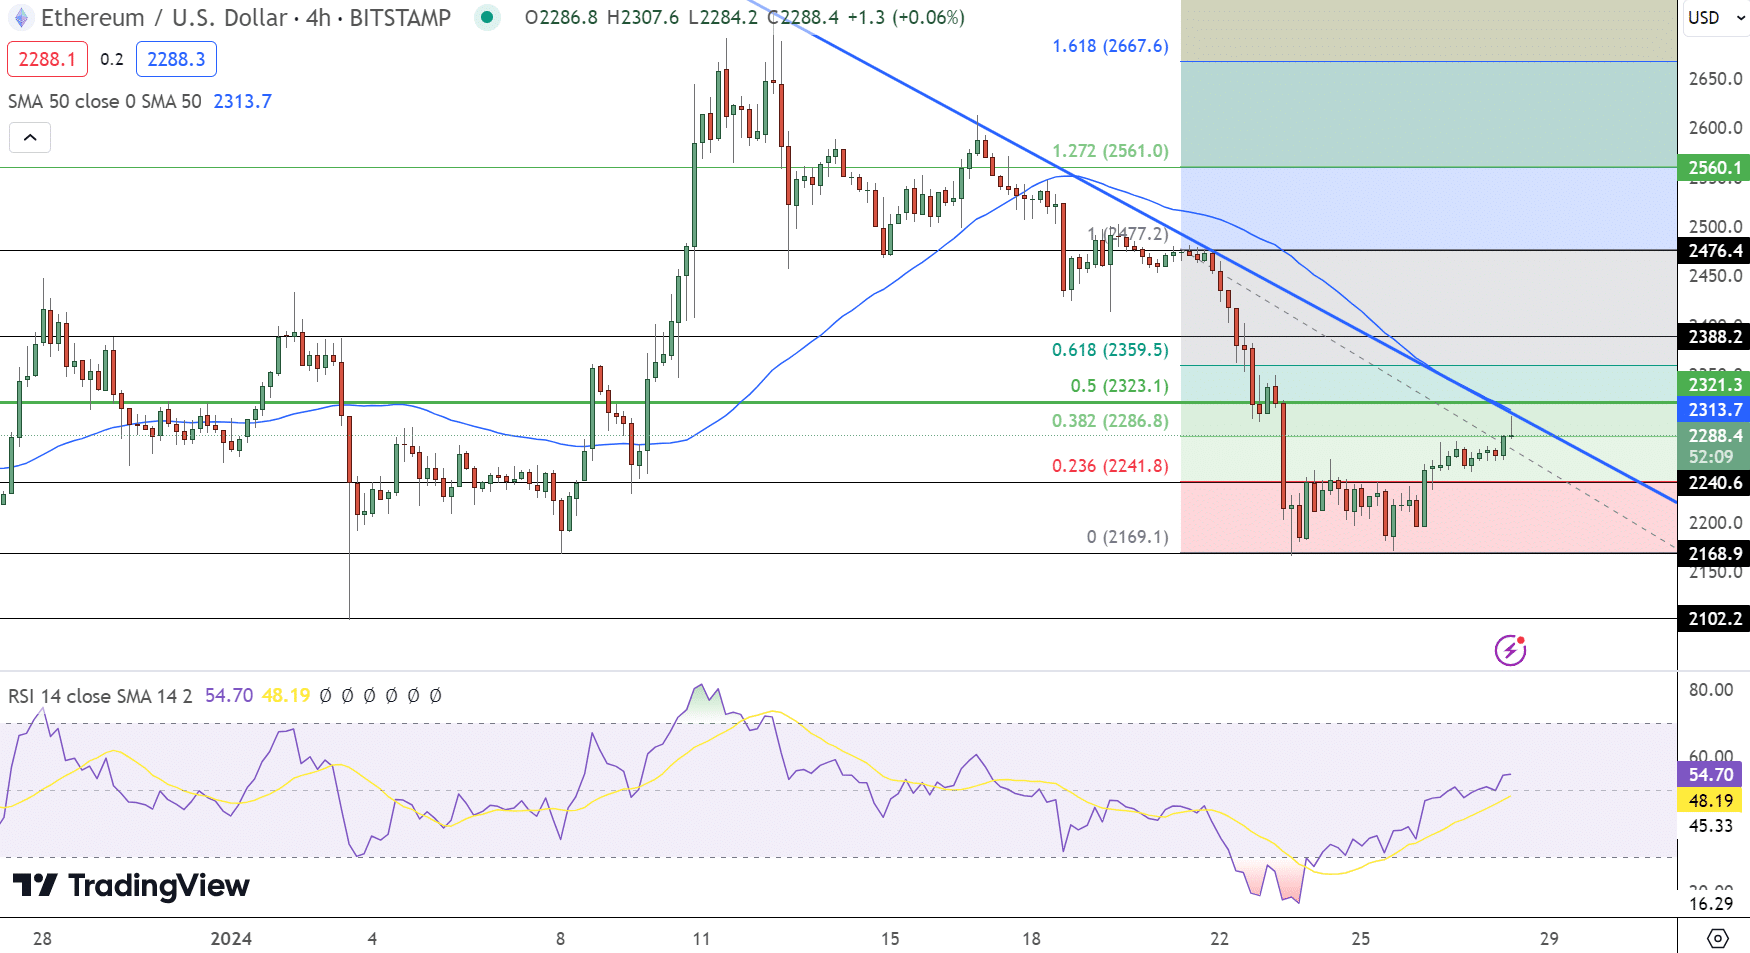 Ethereum Price Chart – Source: Tradingview
The Relative Strength Index (RSI) stands at 54, indicating a neutral market momentum. The 50-day Exponential Moving Average (EMA) is at $2,314, closely aligning with the current price trajectory.
Chart analysis reveals that Ethereum has completed a 38.2% Fibonacci retracement at $2,313. However, a downward trendline near the $2,300 mark may pose a hurdle for further upward movement.
Overall, Ethereum presents a bullish trend above the $2,320 threshold. In the short term, it is expected to test the resistance levels, especially at $2,388, providing traders and investors with key indicators to watch in the coming days.